 |
|
|
|
|
|
|
What is Supply?... Continued
d) Market Equilibrium
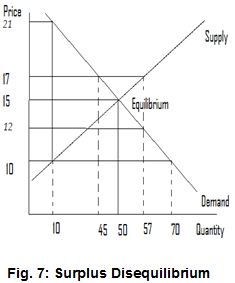 |
Finally, when the supply curve and demand curve are once more overlapped on each other, they again reveal either a disequilibrium or equilibrium. However, in this case as shown in Fig. 9 on the left reveals equilibrium. Therefore at P = 15, there is an equilibrium (i.e., Qs = Qd = 50). Neither surplus nor shortage results so the market clears and is stable |