 |
|
|
|
|
|
|
Cost & Revenue Analysis... Continued
In this section, use PowerPoint or draw the table and figures on board to illustrate the relationships among the revenue types shown below.
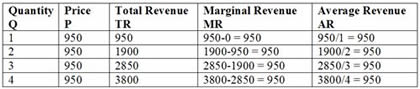
Please note that while the price P remained constant at 950, total revenues TR kept increasing at a constant rate of 950 per additional unit sold. In other words, marginal revenue MR remained constant at 950. Similarly, average revenue AR remained at 950 since on average, each additional unit sold contributed 950.
Implications of the Curves
Referring to figure 3.2 below, please note that price P is set at 950 in the maize industry’s supply and demand forces (such as in the figure on the left). Therefore, no one firm (such as in the figure on the right), can influence the price P which is represented by the line P=MR=AR and just tangent at the intersection of MC and ATC.